Offering services in proteomics, protein analysis by mass spectrometry, and other techniques, as well as custom peptide synthesis.
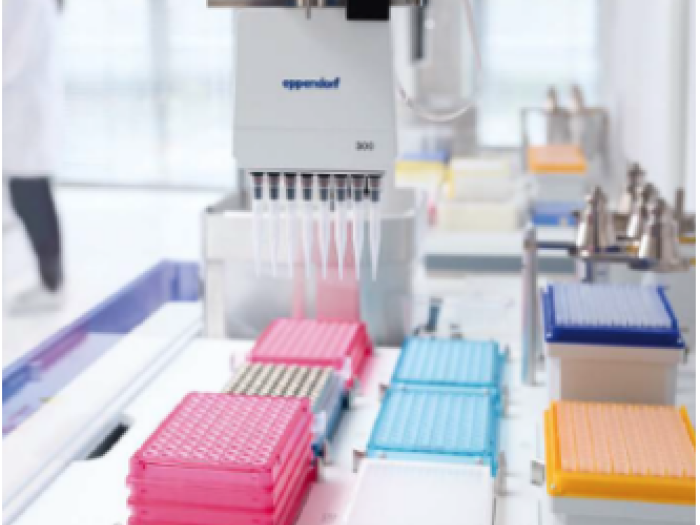
The Proteomics & Peptide Synthesis Core provides research services in proteomics, protein analysis by mass spectrometry, and other techniques, as well as custom peptide synthesis. The Core offers the full range of services in qualitative and quantitative proteomics, including the preparation and analysis of (unprocessed) clinical research samples as well as biological samples.
The Core offers the full range of services in qualitative and quantitative proteomics, including the preparation and analysis of (unprocessed) clinical research samples as well as biological samples.
providing proteomics support from scientific consultation/experimental design and sample preparation all the way to data analysis and interpretation
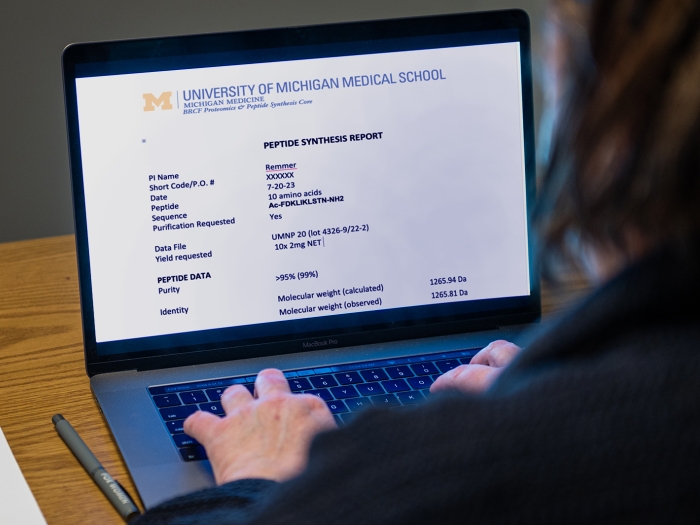
ranging from routine peptides to specialized peptides such as long, hydrophobic, cyclic, or stapled peptides
| Protein Identification and Sequence confirmation/Protein Mapping | Fee/sample | |
| Protein Identification (from gel bands) | $262 | Any stain or no stain accepted, plus $70 for first sample |
| Protein Identification (in-solution) | $490 | No detergents in sample, plus $70 for the first sample |
| Protein Mapping (Sequence confirmation or elucidation/maximum sequence coverage from gel bands) | $780 | Plus $70 for first sample |
| Analysis of Post -Translational Modifications (PTMs)* | Fee/Sample | |
| PTM Profiling (single gel band, 1st sample) | $406 | e.g., phosphorylation, methylation, citrullination, acetylation, biotinylation |
| PTM Profiling (single gel band, per additional sample submitted at the same time) | $336 | aldehydes and more |
| Phosphorylation site mapping with enrichment - single sample | Please Inquire | |
| Phosphorylation site mapping with enrichment - complex sample (cell lysates, tissues etc.) | Please Inquire | |
| Glyco-Screen (localization of N-linked glycosylation) | Please Inquire |
*Scientific Consultation recommended prior to preparing samples for submission.
| Protein Profiling (Qualitative) | Fee/sample | |
| 6 fractions (GELCMS6) - low complexity, qualitative | $610 | (plus $70/$95 for 1st sample) |
| 6 fractions (GELCMS6) - low complexity, qualitative, high sensitivity instrument | $911 | (plus $70/$95 for 1st sample) |
| Molecular Weight Determination of Proteins and Peptides | Fee/sample |
| Intact Molecular Weight by LC-MS (Electrospray Ionisation mass spectrometry) | Please Inquire |
Service includes protein isolation from cells, tissues, media etc, LC-MS/MS, database search, data analysis with statistical validation, relative quantitation and reporting. Services are also available for qualitative protein profiling of complex samples for a lower price—we accept clinical research samples in unprocessed form.
| Quantitative Proteomics* | Fee/sample | |
| Protein expression profiling 10 fractions (GeLCMS10) | $1,520 | plus $70 for 1st sample |
| Protein expression profiling 20 fractions (GeLCMS20) | $2,146 | plus $70 for 1st sample |
| Protein expression profiling 40 fractions (GelCMS40) | Please Inquire | plus $70 for 1st sample |
| Label-free quantitation, single shot, 1 hour | Please Inquire | plus $70 for 1st sample |
| Label-free quantitation, single shot, 2 hours | $1,044 | plus $70 for 1st sample |
| Label-free quantitation, single shot, 3 hours | $1,309 | plus $70 for 1st sample |
| Label-free quantitation, single shot, 4 hours | Please Inquire | plus $70 for 1st sample |
| Relative quantitation (alternatives to label-free quantitation): SILAC, TMT | Please inquire | Pricing dependent on project scope |
| "Absolute" quantitation: Parallel reaction monitoring (PRM) | Please inquire | Pricing dependent on project scope |
*Scientific Consultation required prior to preparing samples for submission.
| Pathway Analysis, Data Analysis, N-terminal (Edman) sequencing, Amino Acid Analysis | Fee/sample | |
| Data Interpretation (exceeding the scope of a regular project) | $285 | Pricing dependent on project scope |
| Pathway Analysis (yields pathways, GO terms, and more for diff. expressed proteins) | $300 | Up to 5 comparisons |
| N-terminal Sequencing, Edman, 5 amino acids per sample | $362 | plus $95 for 1st sample |
| Amino Acid Analysis | $274/$301 | Pricing dependent # of samples submitted at the same time; plus $95 for 1st sample |
| Custom Services | Please Inquire |
Policy
Samples will not be processed before request form has been completed and shortcode has been provided. Cancelations are not accepted after analysis, synthesis or preparation steps have been started. In case of an undesired result due to the nature of the submitted sample or peptide sequence, fees still apply.
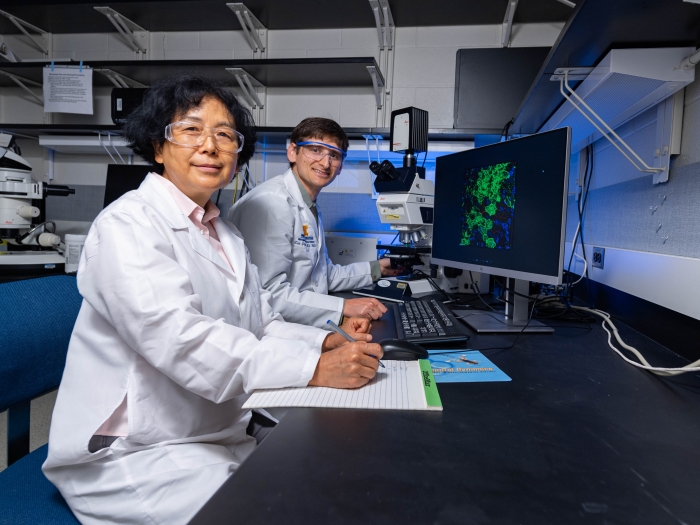
The Core director Dr. Remmer has 24 years of experience directing a Proteomics & Peptide Synthesis Core. Her scientific expertise in these areas is backed by years of research experience, including postdoctoral training in academia and industry.
D. Tyrrell, J. Chen, B. Li, S. Wood, W. Rosebury-Smith, H. Remmer, L. Jiang, M. Zhang, M. Salmon, G. Ailawadi, B. Yang, and D. Goldstein. Aging alters the aortic proteome from health to thoracic aortic aneurysm. Aterioskler Thromb Vasc Biol 2022, Aug 42(8): 1060-1076; PMID: 3551055
E. Giuliani, SB Schon, K.Yang, GW Burns, LM. Neff, HA .Remmer, JA. Teixera, EE. Marsh. Obesity-induced follicular phase endometrial proteome dysregulation in a well-phenotyped population. FS Sci 2022 Nov; 3(4):367-375 PMID: 3570094
BE Biesterveld, AZ Siddiqui, RL. O’Connell, H Remmer, AM. Williams, A. Shamshad, WM. Smith, MT.Kemp, GK. Wakam, HB. Alam. Valproic acid protects against acute kidney injury in hemorrhage and trauma. J. Surg. Res. 2021, Oct 226:222-229, PMID: 34023578
R. Ohara, G. Edhayan, S. Rasmussen, T. Isozaki, H. Remmer, T. Lanigan, PL. Campbell, A. Urquhart, J. Lawton, K. Chung, D. Fox, J. Ruth. 2019. Citrullinated Inhibitor of DNA Binding 1 is a Novel Autoantigen in Rheumatoid Arthritis. Arthritis Rheumatol. Mar 12, doi: 10.1002/art.40886 (epub ahead of print), PMID: 30861322
WR. Swindell, HA. Remmer, MK. Sarker, X. Xing, DH. Barnes, L. Wolterink, JJ. Vorhees, RP. Nair, A. Johnston, JT. Elder, JE. Gudjonsson. Proteogenomic analysis of psoriasis reveals discordant and concordant changes in mRNA and protein abundance. 2015. Genome Med. Aug 4;7 (1):86. Doi: 10.1186/s13073-015-0208-5.e Collection 2015.
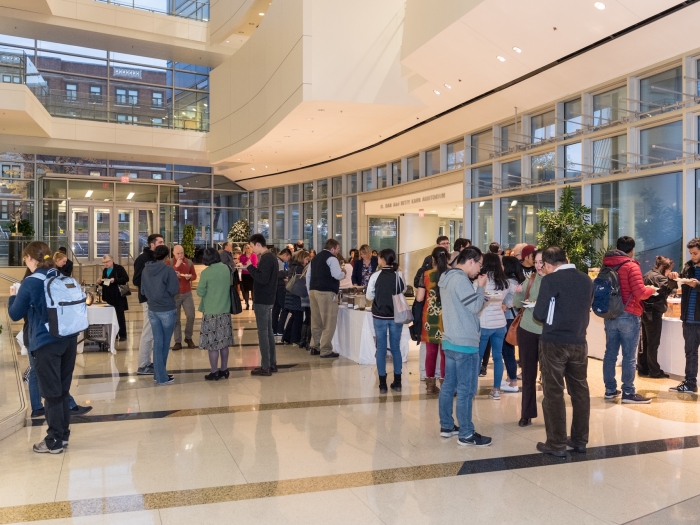
The Proteomics & Peptide Synthesis Core organizes seminars. They are usually announced on this website and by email.
May 2, 2023
November 16, 2018
May 25, 2017
Yes, we certainly do. Please contact [email protected] for more details.
For Proteomics and protein analysis projects: usually 5-15 business days depending on the type of service.
For Peptide Synthesis projects: usually 2-3 weeks.
For Pathway Analysis: 1-4 business days.
Our prices are listed on our website. We think that our prices are comparable to other Cores and competitive. Some of our prices may appear high, as we include sample preparation and reasonable fractionation for many of our proteomics options. Please inquire and/or schedule a consultation by contacting the Core.
If you think that we contributed intellectually to your project it is appropriate to list us as co-authors. If you want a more detailed explanation of authorship when using a core facility please have a look at the ABRF Authorship Guidelines. These are the standards of the Proteomics Community most core facilities follow when there are questions about authorship.
Yes, we usually discuss sample preparation tailored to the project during the consultation, in person, by phone or email. In general, you may find useful of protocols, buffers and kits on the ThermoFisher web site. For highly complex samples and clinical samples we prefer to perform sample preparation at the Core and highly recommend submission of frozen cells/tissue/blood plasma or other biological or clinical sample formats. Please contact the Core in regards to sample quantity and special protocols.
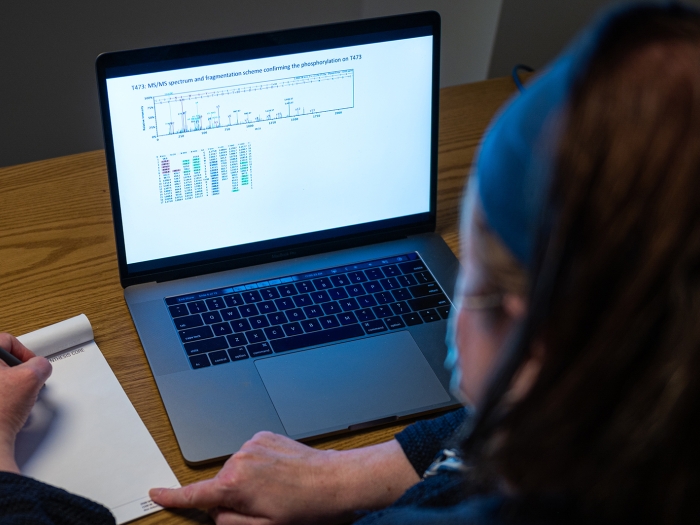
Scaffold is a user-friendly software platform to visualize and validate MS/MS proteomics experiments. This versatile software is available for download as a free viewer. Training is available at the Core. The free viewer allows you to identify proteins intuitively and confidently, compare samples to identify biological relevance, identify protein isoforms and localize protein posttranslational modification (PTMs), drill down into the MS/MS spectra and spectral counts, create comprehensive lists of target proteins, classify proteins according to Gene Ontology terms, quantitate proteins by spectral counting (label-free) and TMT.
When you obtain results from the Core, you will typically obtain 3 data files, a project report with experimental conditions and the results summary (word document), a list of identified proteins with contaminants removed (in excel) and the Scaffold file. When we discuss your results, you will be trained to use the Scaffold viewer, so you can extract the most information from your data. The Proteome Software website also has tutorials on how to use Scaffold.
Yes. In addition to individual software training and data interpretation, we will be happy to come to your research group meeting or department meeting to give a concise presentation on proteomics topics of your interest. We also organize regular seminars (2-3 per year) where we invite speakers to present on relevant and trending proteomics topics related to new services.
There are two ways to quantitate proteins by mass spectrometry, label-free and labeled.
Label-free quantitation uses the spectral count (number of MS/MS spectra assigned to an identified protein) for relative quantitation. This method is used in protein expression profiling and yields the “fold-change” of a given proteins between samples or categories of samples. Under labeled quantitation we offer metabolic labeling (stable isototope labeling by amino acids in cell culture, SILAC) and quantitation by Tandem Mass Tags (TMT) , both yield relative quantitation using peak area. The most accurate method is quantitation using a heavy isotope-labeled internal standard, as done in Parallel reaction monitoring, PRM (or SRM, MRM).
For the need of replicates, please see that topic in our FAQ.

If you want to use label –free proteomics as stand-alone method of quantitation, 3 replicates (n=3) are necessary. Alternatively, you can use n=1 and validate the quantitation using an orthogonal method such as western blotting or parallel reaction monitoring (PRM) by mass spectrometry. In a TMT experiment, no replicates are necessary, n=1 is sufficient although for some experiments, duplication or triplication is recommended. No replicates are needed for PRM experiments, since quantitation happens based on an internal standard.
Pathway Analysis (also known as functional enrichment analysis) is used to analyze data obtained from proteome expression profiling or other proteomics experiments. Pathway Analysis relates the statistical analysis of the data set with biological function by identifying the biochemical pathway and how the differentially expressed proteins influence other proteins or pathways. This can lead to the identification of additional target proteins. The software we use is the iPathway guide by Advaita Bioinformatics. We usually upload Scaffold data, but can also work with any data set in excel format that contain a protein ID, a p-value and a fold-change.
In general: detergents, glycerol and urea (>2M). For mass analysis of intact proteins, we list acceptable and non-acceptable buffer components on our request form.
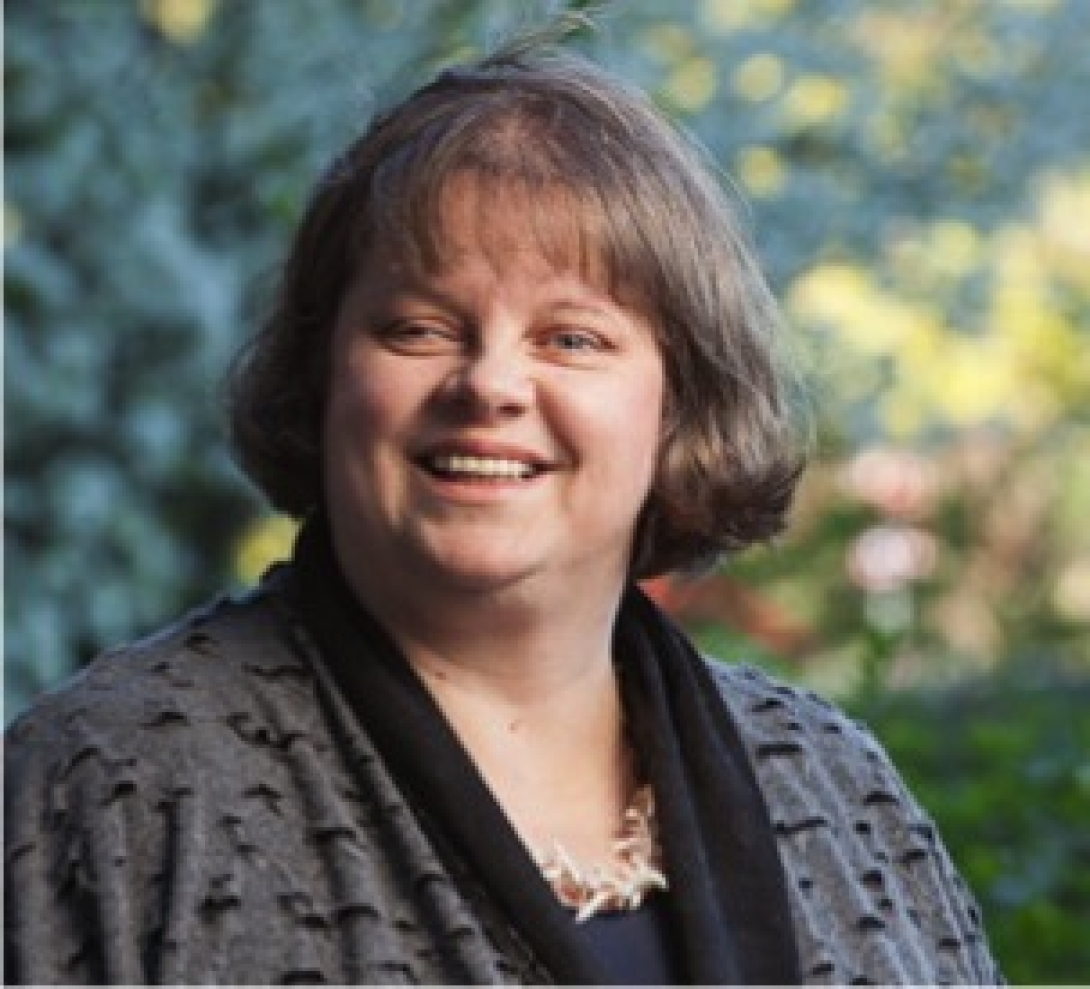
Dr. Henriette Remmer received her M.S. and Ph.D. in Biochemistry. Dr. Remmer’s expertise in peptide and protein chemistry, including protein mass spectrometry, is backed by years of research and core facility experience. Dr. Remmer regularly participates in research studies and has provided leadership to international research committees in proteomics, protein sequencing, and protein mass spectrometry, as well as peptide synthesis, with the Association for Biomolecular Resource Facilities (ABRF).
1150 West Medical Center Drive
Ann Arbor, MI 48109